Data Analysis and Visualization with Power BI and Python
Overview:
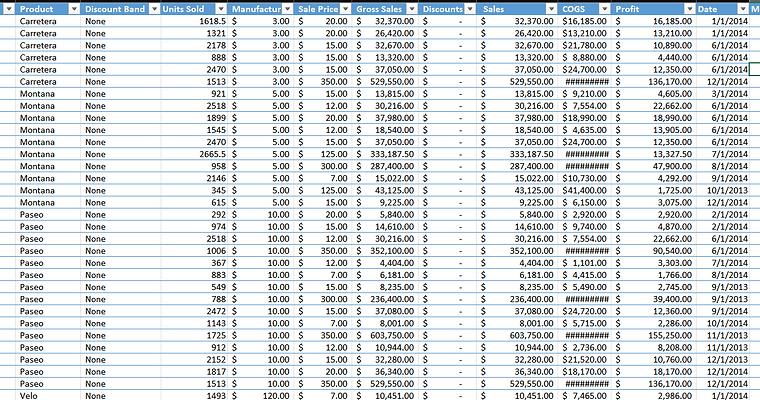
This project aims to showcase expertise in data analysis and visualization by leveraging Power BI and Python to analyze a dataset from an Excel file. The dataset consists of sales data, customer demographics, or marketing campaign metrics. The project demonstrates the ability to extract actionable insights from raw data and present them in an intuitive and visually appealing manner.
Key Components:
-
Data Preparation: The Excel file containing the raw data is cleaned and prepared for analysis. This involves handling missing values, removing duplicates, and transforming data types as necessary to ensure data integrity.
-
Power BI Dashboard: A comprehensive Power BI dashboard is created to provide an overview of the dataset. The dashboard includes interactive visualizations such as bar charts, line graphs, and pie charts to showcase key metrics and trends. Users can filter and drill down into the data to gain deeper insights.
-
Python Analysis: Python scripts are utilized to perform advanced analysis on the dataset. This may involve statistical analysis, machine learning algorithms, or custom data transformations depending on the nature of the data. For example, predictive modeling could be used to forecast future trends, while clustering algorithms could identify distinct customer segments.
-
Integration: The Power BI dashboard is enhanced with insights derived from the Python analysis. This integration allows for a holistic view of the data and provides stakeholders with actionable insights for decision-making.
Benefits:
-
Provides stakeholders with a comprehensive understanding of the dataset and actionable insights for decision-making.
-
Demonstrates proficiency in both data visualization (Power BI) and data analysis (Python).
-
Showcases the ability to leverage advanced analytics techniques to derive meaningful insights from raw data.
-
Highlights strong analytical skills, attention to detail, and the ability to communicate complex findings effectively.
Conclusion:
This project serves as a compelling example of data analysis and visualization skills, showcasing the ability to extract actionable insights from raw data using Power BI and Python. It demonstrates the candidate's proficiency in both tools and their capability to deliver valuable insights to stakeholders in a visually appealing manner.